Visual Analytics Tools Tools for the Study of Complex Problems in Engineering and Biomedicine
🇪🇸 PID2020-115401GB-I00
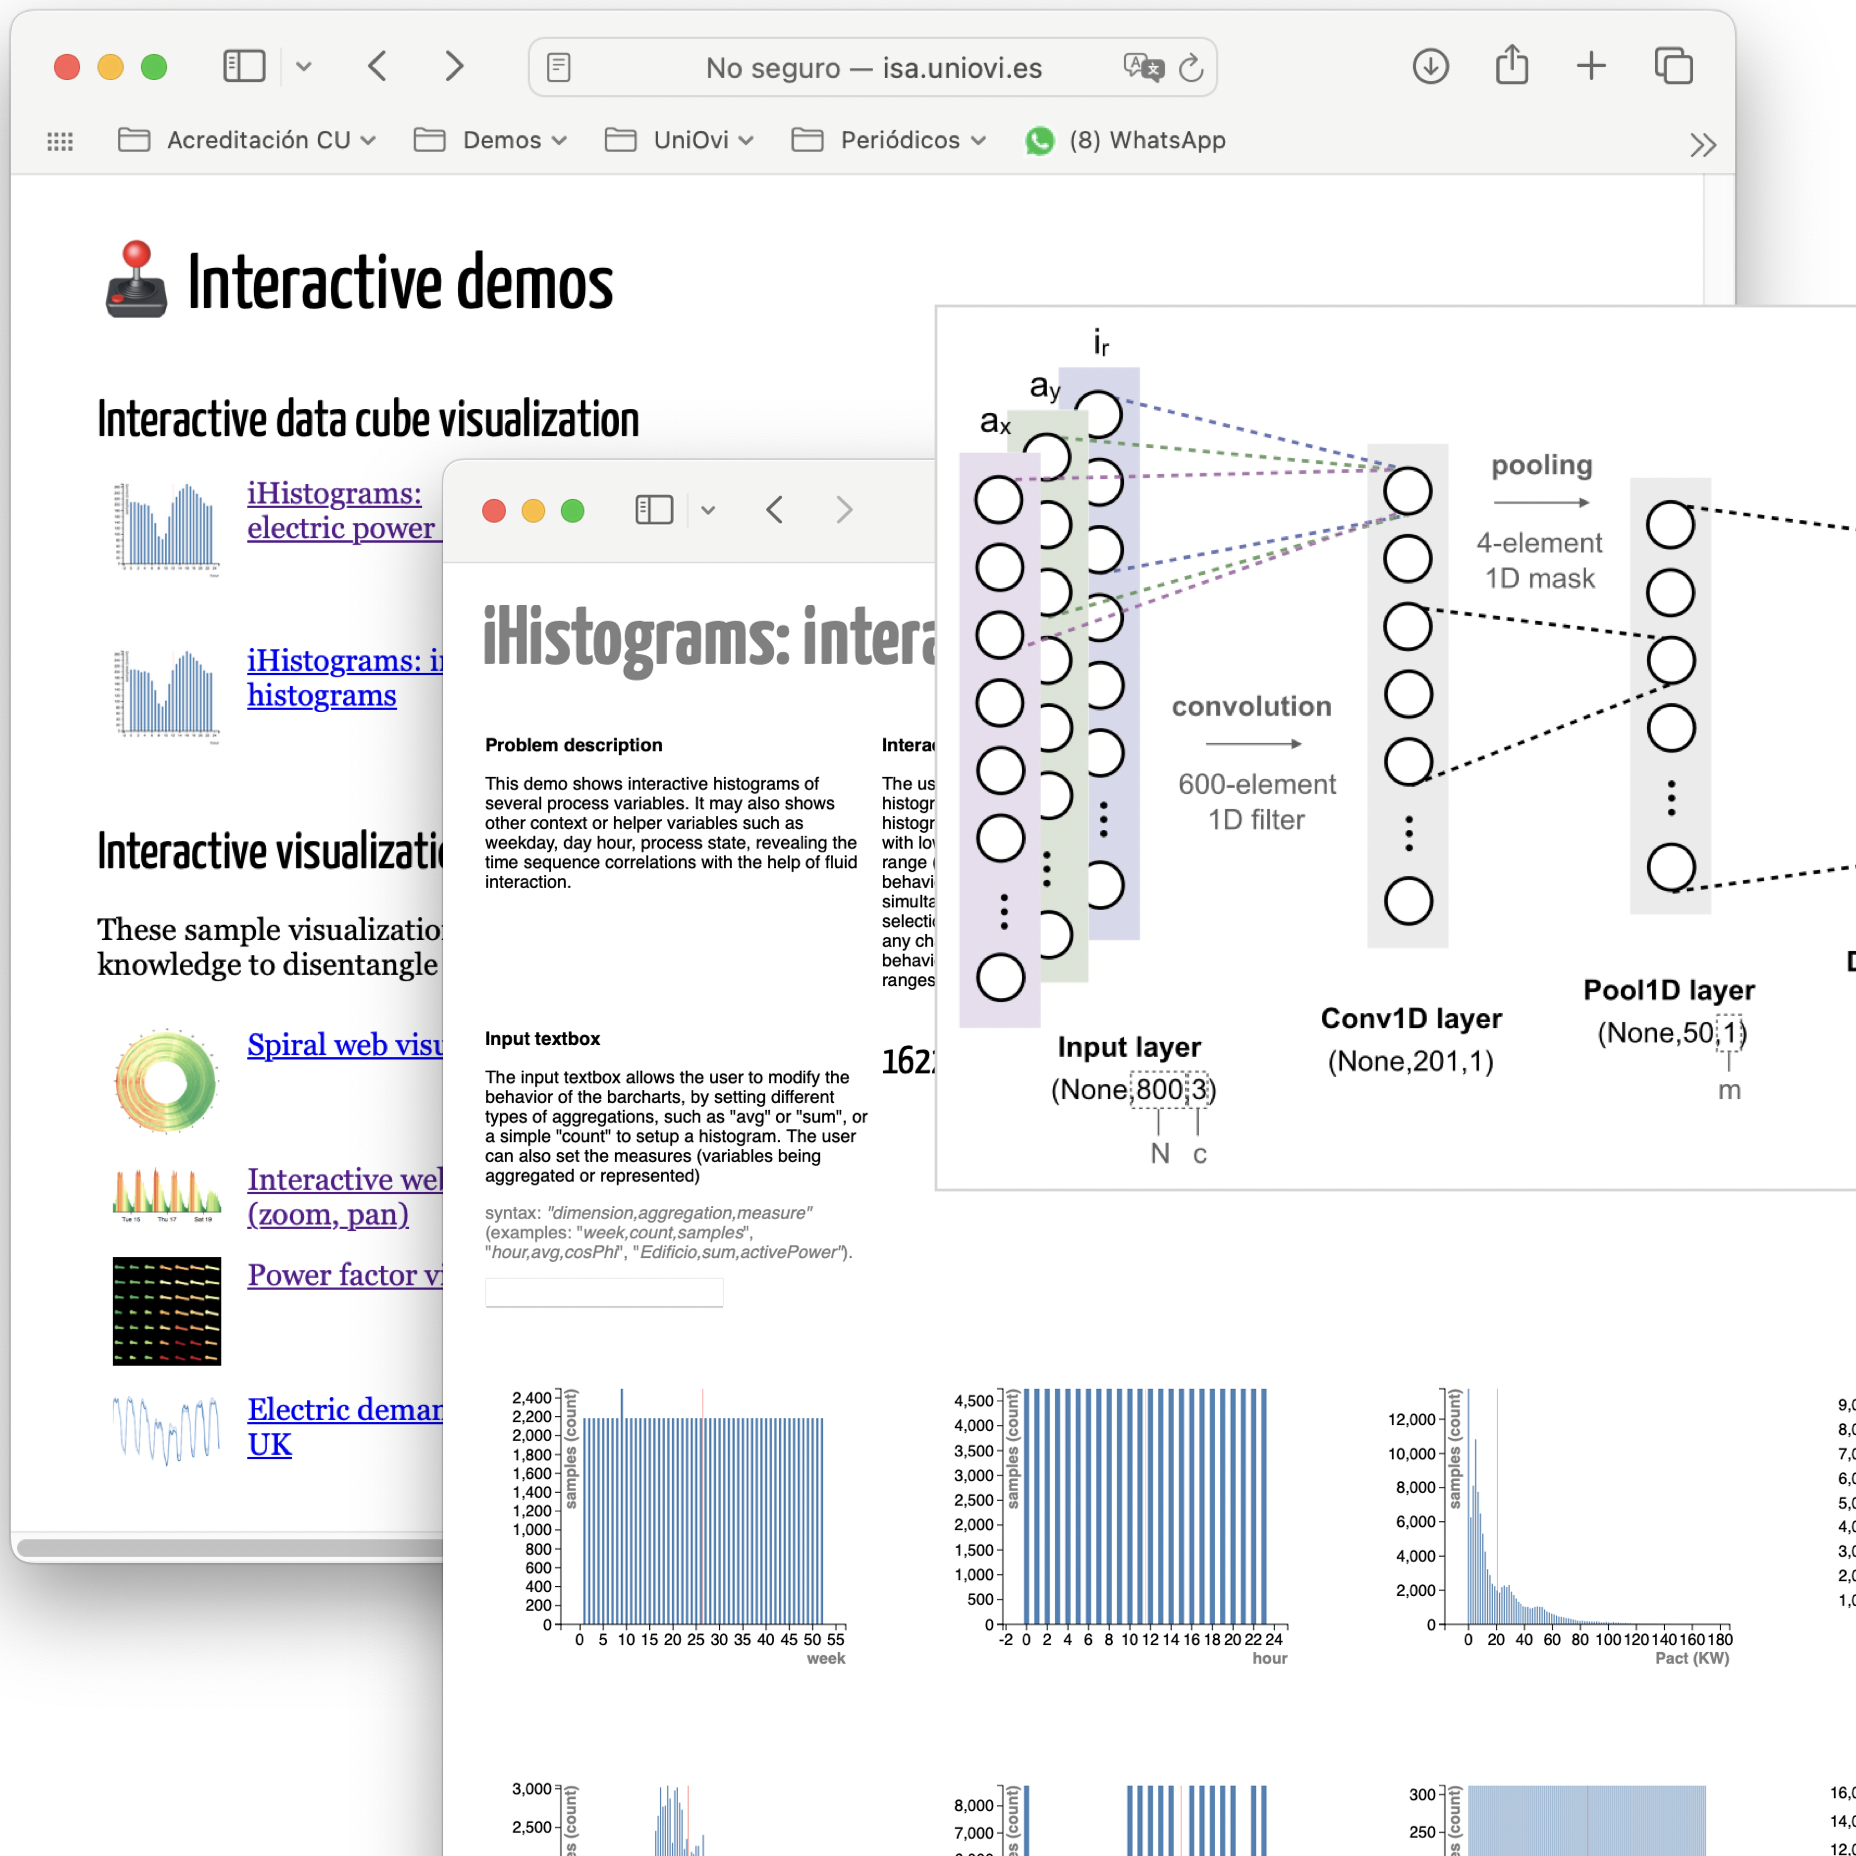
In this project, we propose tackling complex problems in engineering and biomedicine by combining human intuition with machine learning. Traditional algorithms, though accurate, struggle with poorly defined problems and changing contexts. We will develop visual analysis techniques and tools that integrate human interaction, data visualization, and machine learning. This hybrid approach leverages human adaptability and machine precision to enhance exploratory and iterative analysis. Our goal is to create user-driven methods for solving real-world engineering and biomedical challenges, harnessing experts' domain experience in these fields.

Visual Analytics Techniques for the Improvement of Efficiency in Processes and Buildings
🇪🇸 DPI2015-69891-C2-2-R
Energy and process operation data is often complex and not presented in an intuitive way, leading to poorly informed decisions. Our research group aims to develop tools that utilize data from buildings and industrial facilities to enhance energy awareness and suggest efficiency strategies. This project focuses on creating visual analytics methods for system and process monitoring that help users discover and understand factors affecting energy efficiency by combining classification, forecasting, and dimensionality reduction algorithms with information visualization and interaction principles. The tools we develop will handle large, varied real-world data from universities, hospitals and industrial partners to provide intuitive and actionable insights that can lead to more informed energy management decisions.

CONEDUCON: Learning Analytics in Control Education
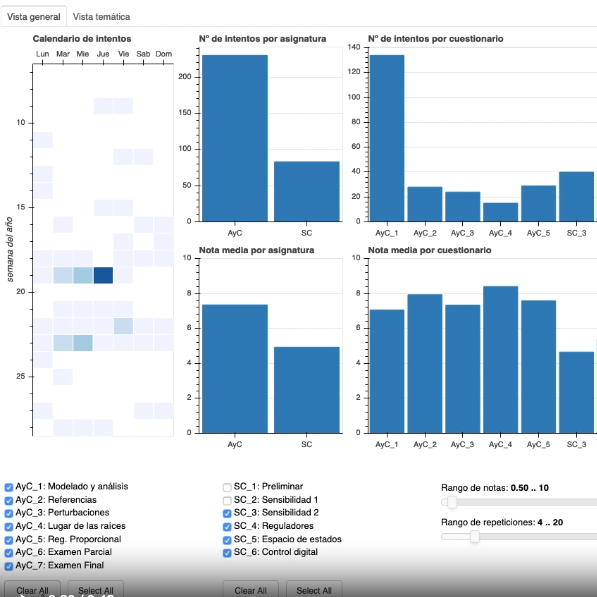
In the conEDUcon project we created an innovative tool for Moodle, allowing students to learn concepts of automatic control through parametric quizzes. The tool includes a Matlab library that generates random quizzes and answers, packaged in reusable GIFT files for easy sharing among teachers. This tool enhances online self-learning and, in addition, provides valuable student performance data, which can reveal insights into course interest, dropout rates, and concept difficulties. Moodle's data capture features enable easy extraction of quiz information, such as grades and attempts, in CSV format. We used learning and visual analytics to offer detailed, easily interpretable information. An interactive visual application was developed to present data on quiz attempts, course activity, grade evolution, and topic relationships across different subjects.


