Morphing projections (MP)
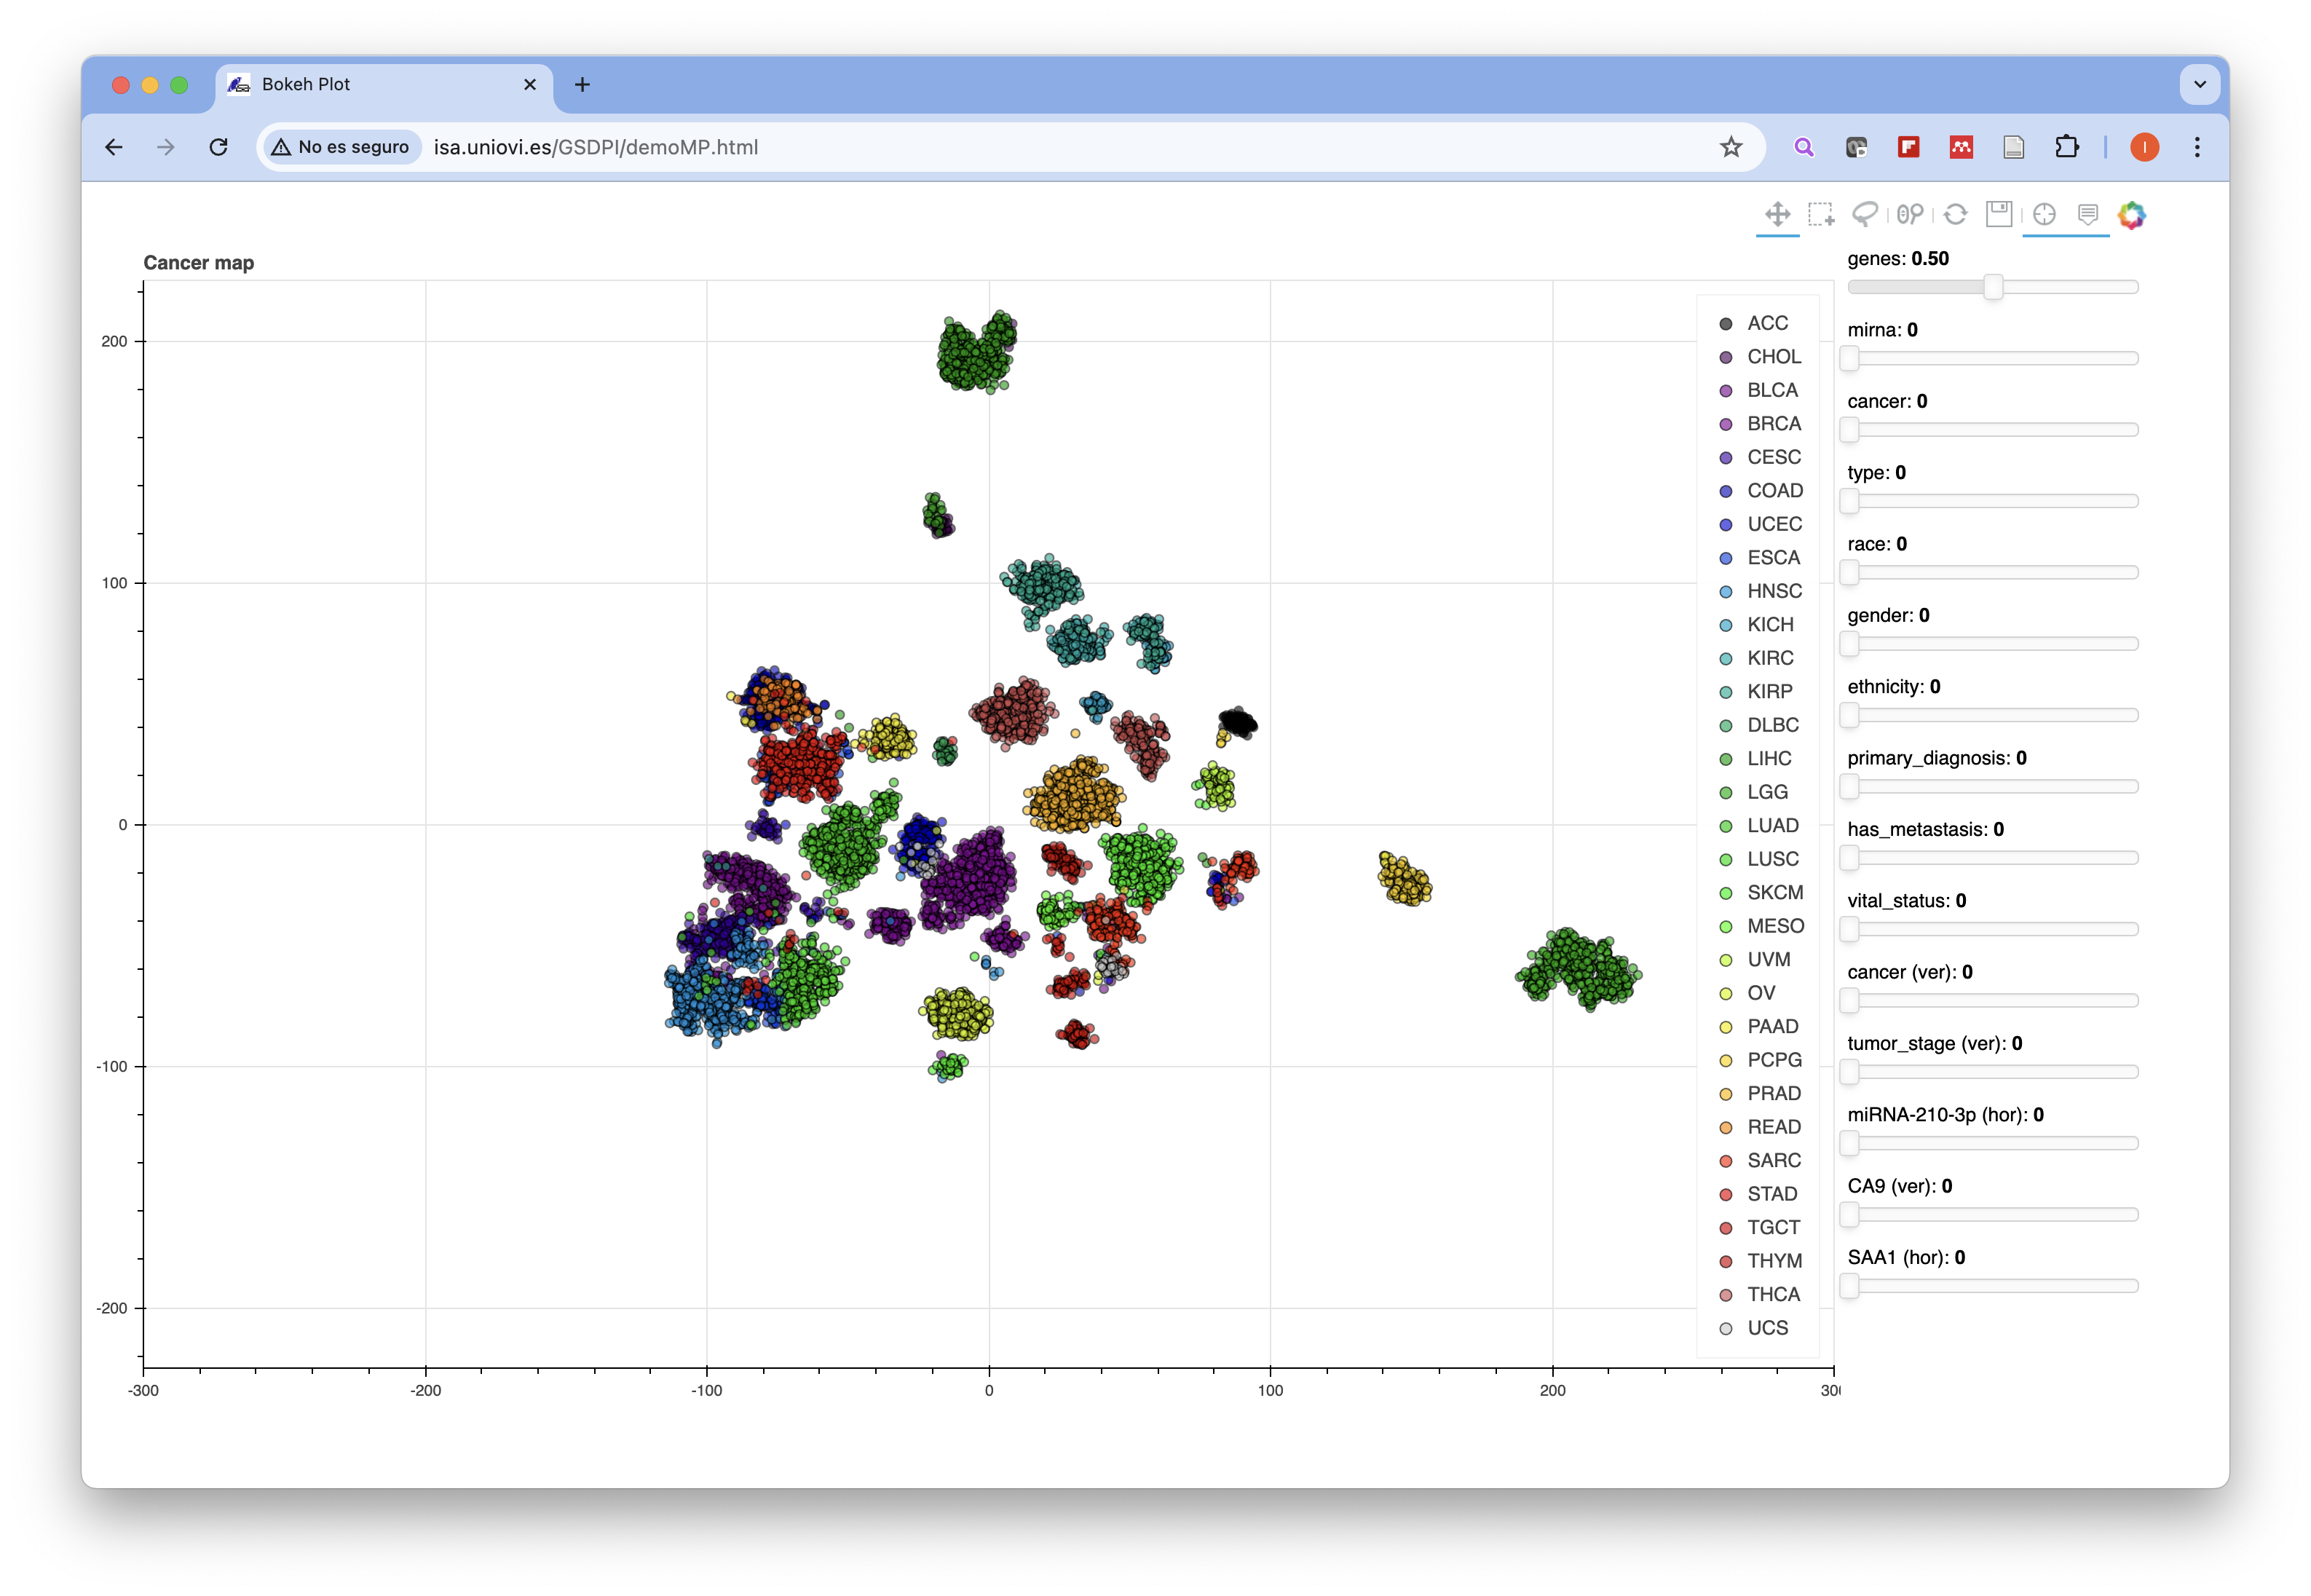
Small demo application of the morphing projections technique to visualize cancer genomics data. Demo version of the paper published in Bioinformatics at 2021.
paper code videoYou will find here a showcase of demo applications (proofs-of-concept and prototypes we have developed for papers, projects, or just for experimentation), and open-source libraries in Python and Matlab

Small demo application of the morphing projections technique to visualize cancer genomics data. Demo version of the paper published in Bioinformatics at 2021.
paper code video
Interactive visualization of the Gene Expression Matrix (GEM). The user can browse the GEM and reconfigurate its rows and columns by similarities in their expression levels. Also, 2D sample map and gene map show the projections of the samples (rows) and genes (columns) according to the gene expressions on selected subsets of interest. Demo app presented for paper of IEEE Journal of Biomedical and Health Informatics, 2023
paper code video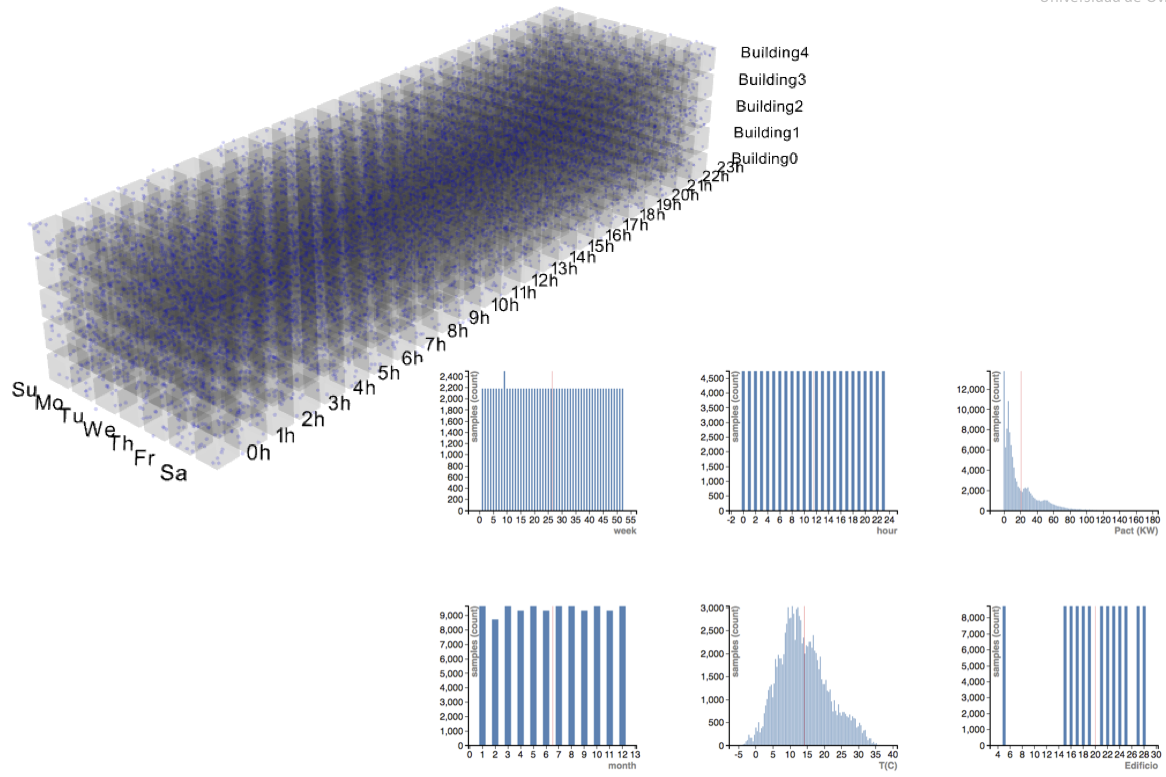
Interactive data cubes for power demand analysis in a large facility (university campus) with several buildings. Demo app presented for paper of Energy and Buildings, 2017
paper
Dual interactive dimensionality reduction of samples and genes. DR projections of samples and genes based on their expression levels co-evolve for changes in user-selected subsets of genes and samples. Demo app of paper presented at ESANN 2022.
paper video
Morphing projections demo app featuring interactive aggregation functionality for energy analytics in residential Buildings.
paper code
Interactive dimensionality reduction of vibration and currents of an induction motor. Version coded in processing from the original paper at ESANN 2014.
paper
Interactive dimensionality reduction of vibration and currents of an induction motor (version coded in p5js)
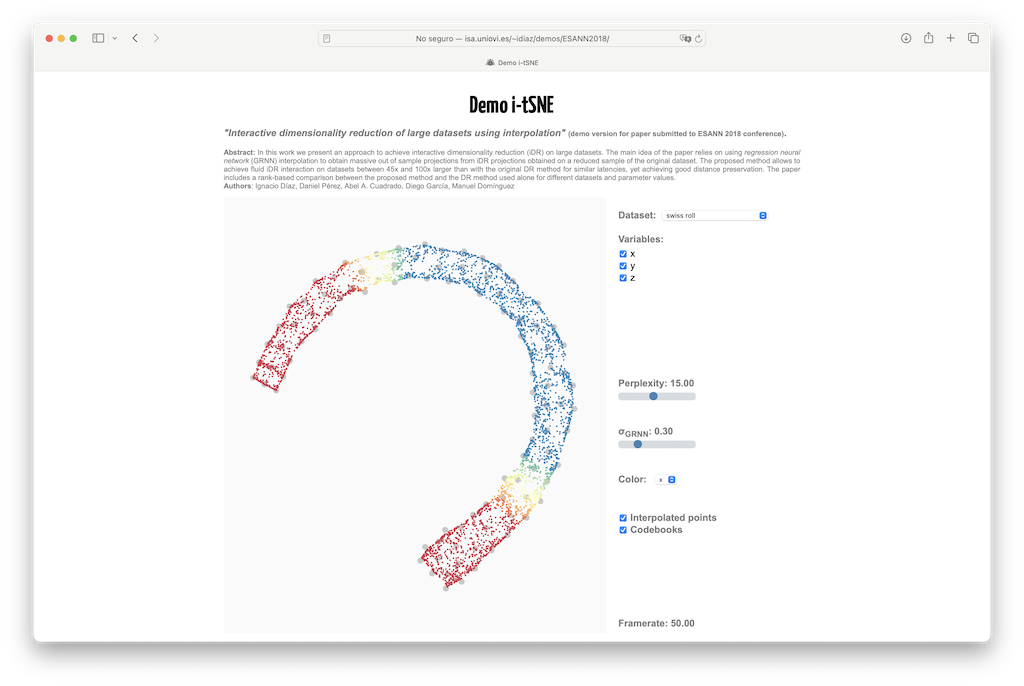
Demo of fast interactive dimensionality reduction using tSNE and projection interpolation (paper presented in ESANN2018)
paper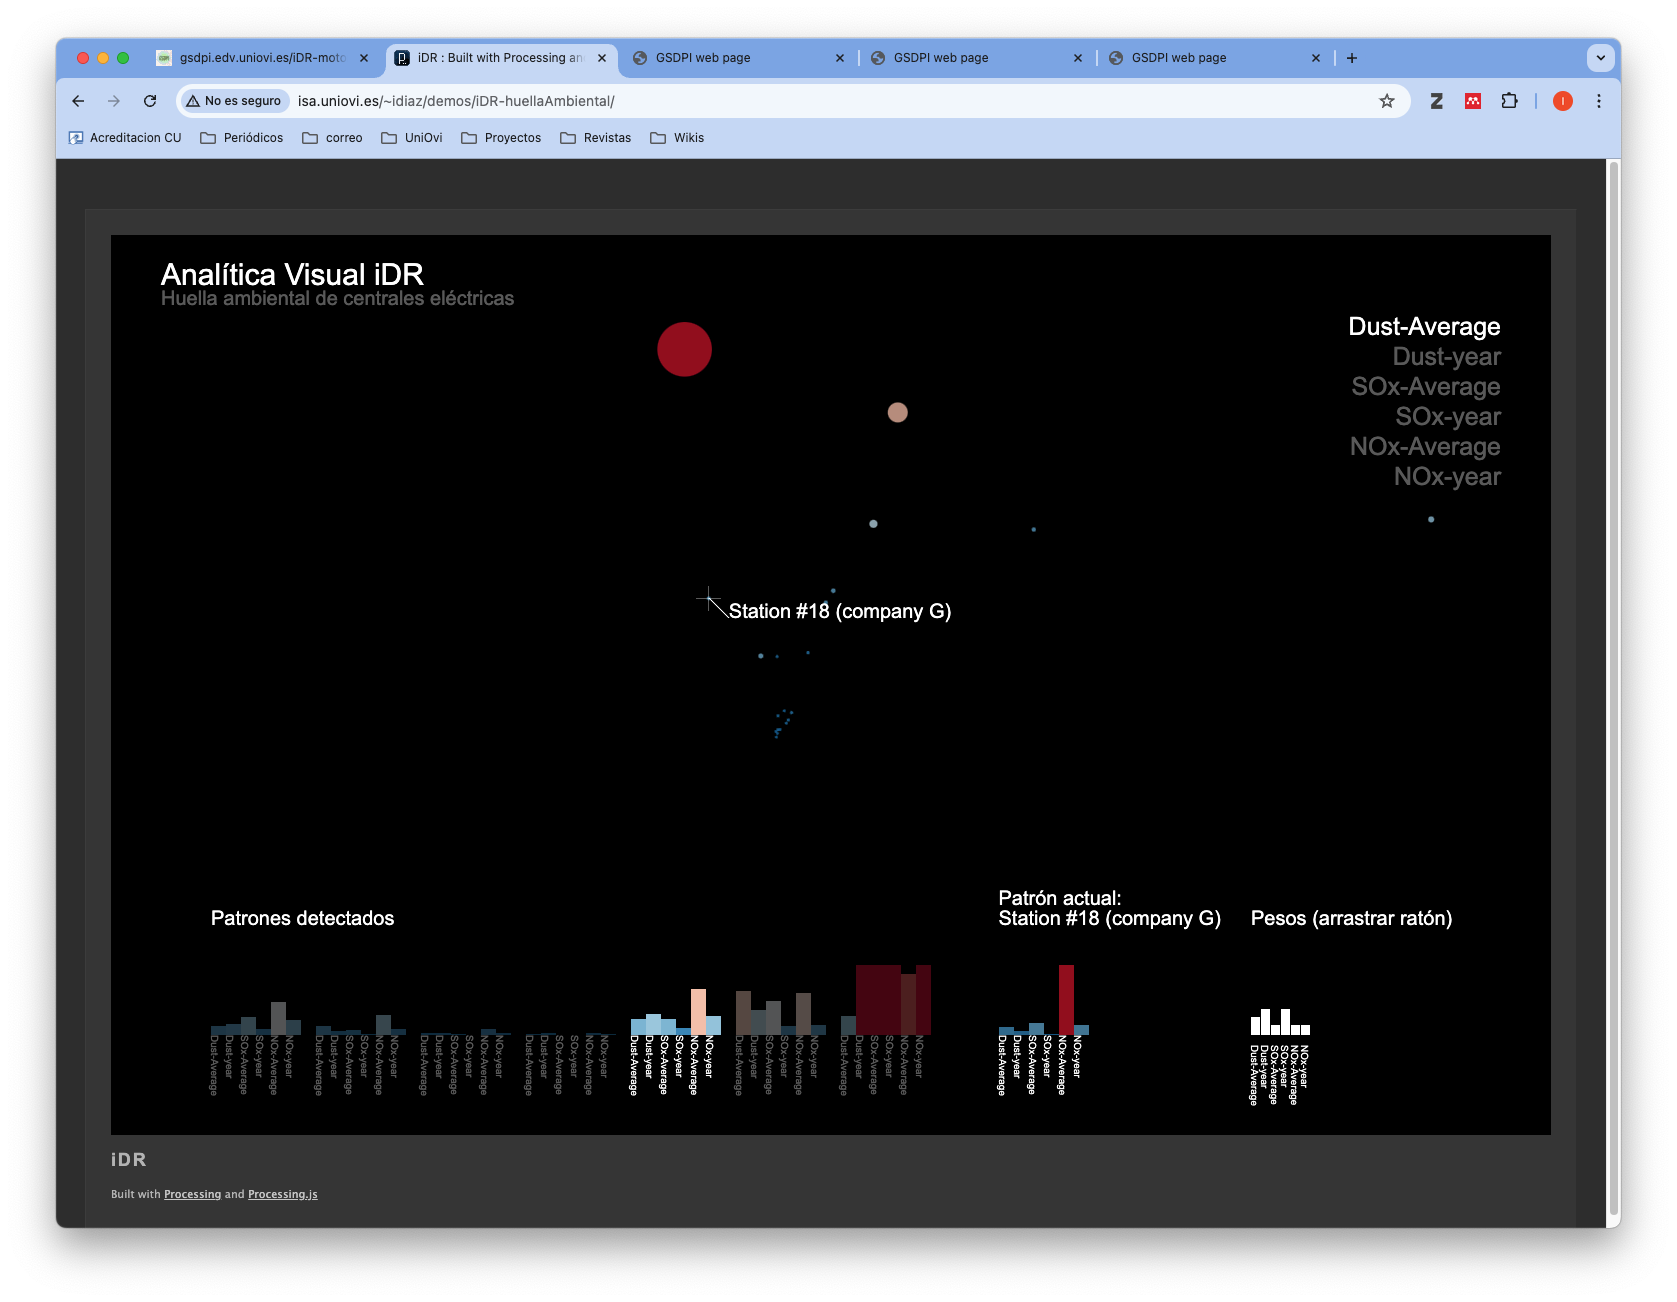
Interactive dimensionality reduction showing environmental footprint parameters of several power stations

Interactive dimensionality reduction of power demand data
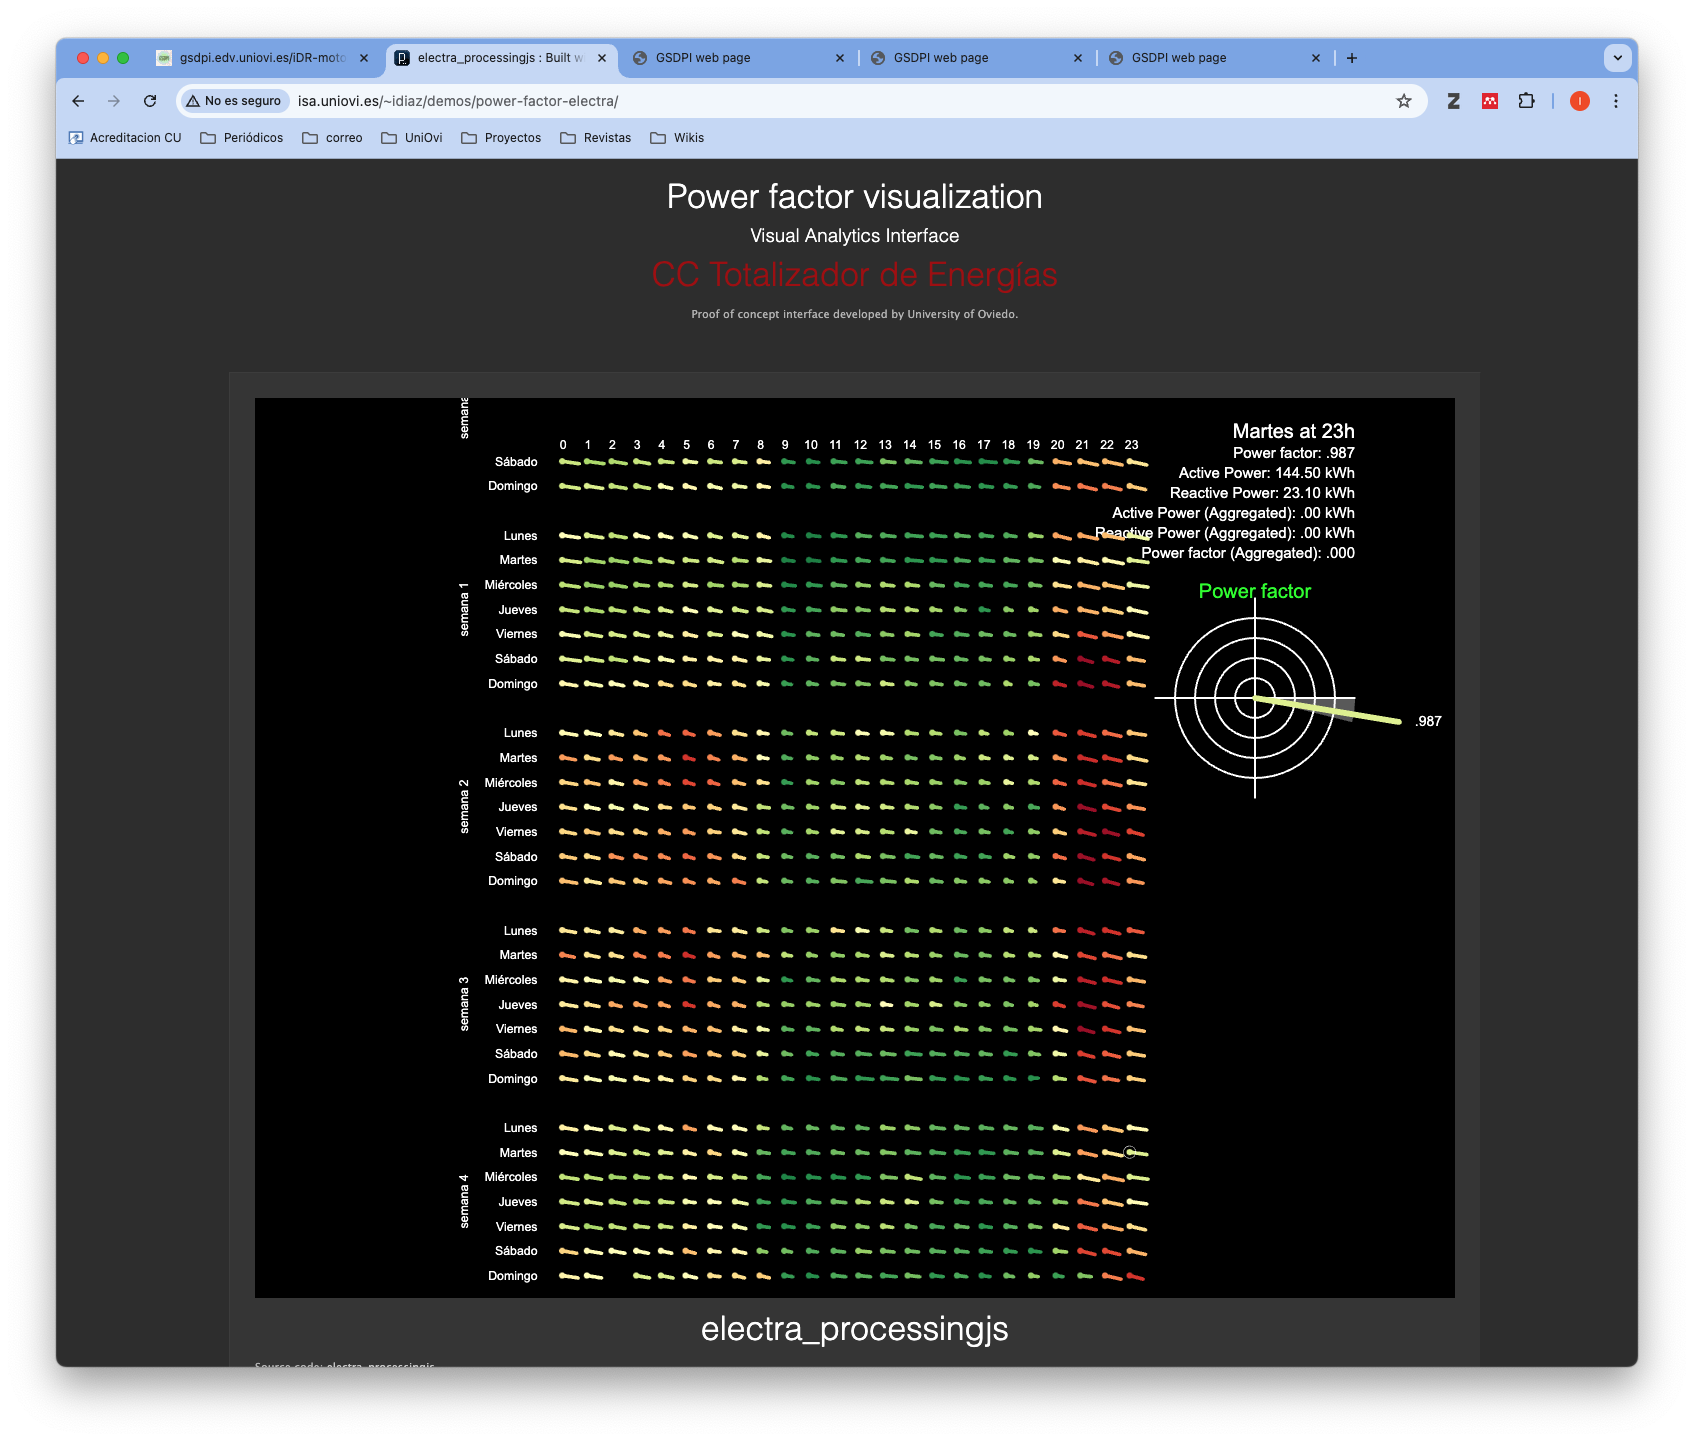
Example of an ad-hoc interactive data visualization, showing the power demand along with power factor using a weekday-hour spatial configuration.
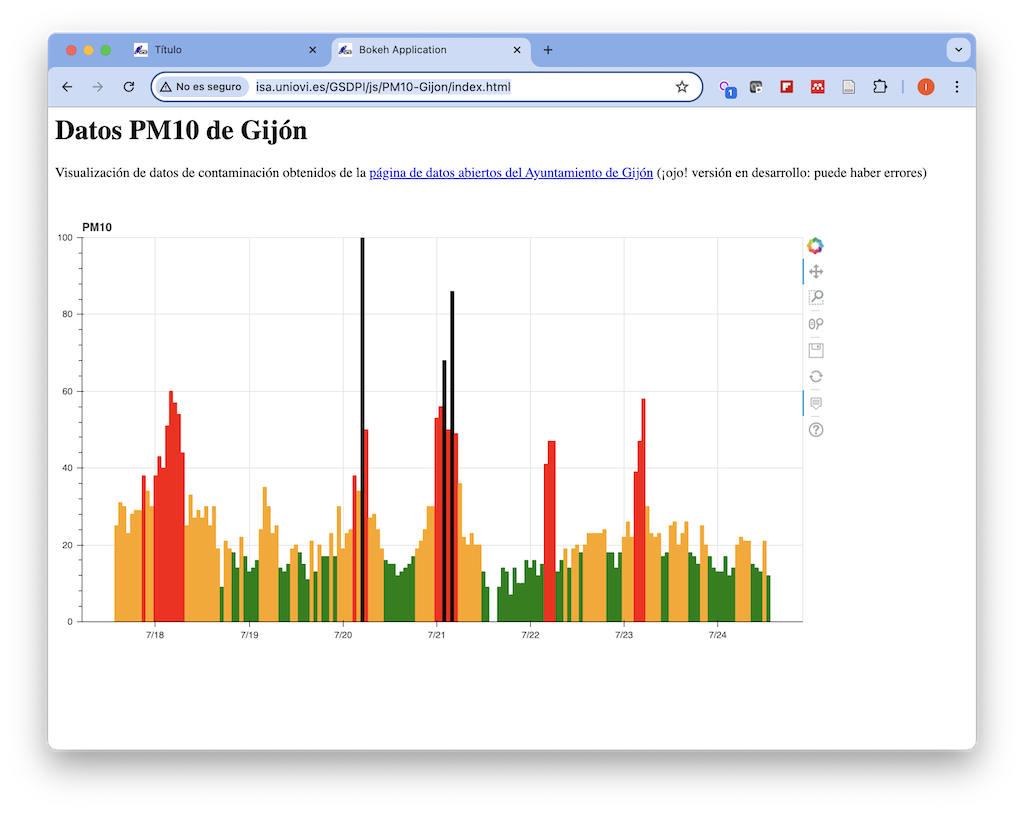
Live monitoring of PM10 particle levels at Gijón from open data provided by Ayuntamiento de Gijón. PM10 data are updated on an hourly basis.